
Published 12/2023
https://www.udemy.com/course/powerpoint-for-teachers-p/
Language: English | Duration: 1h 17m
How to Make Engaging Lessons

Language: English (US)
Learn Google Sheets from Beginner to Advanced - Learn Pivot Tables - Graphs -Dashboards - & More!
https://www.udemy.com/course/the-complete-google-sheets-course-google-spreadsheet-tips/

Language:
Learn Primavera P6 Essentials and Unleash Efficient Project Planning and Schedule Management for Your Project
https://www.udemy.com/course/project-schedule-management-oracle-primavera-p6-foundations-training/

Learn Professional PowerPoint AI Course: From Basic To Advanced

Learn AI-Powered Presentations: Elevating Your Skills from Noob to Expert

Language: English (US)
Unlock Excel's Power: Data Entry, Formulas, Analysis, Efficiency
https://www.udemy.com/course/excel-101-for-beginners/

Language: English (US)
Boost Productivity - Master Gmail Tips, Tricks, and Techniques - Learn Email Strategies To Make Your Time More Effective
https://www.udemy.com/course/complete-gmail-productivity-course-more-productive-email/

Language: English (US)
Time Attendance systems for managers and technicians
https://www.udemy.com/course/time-attendance-systems-the-complete-guide/

Published 12/2023
MP4 | Video: h264, 1920x1080 | Audio: AAC, 44.1 KHz
Language: English | Size: 8.43 GB | Duration: 14h 21m
Unlock the Power of Microsoft Excel: A Comprehensive Guide from Beginner to Expert Mastery

Published 12/2023
MP4 | Video: h264, 1920x1080 | Audio: AAC, 44.1 KHz
Language: English | Size: 597.04 MB | Duration: 1h 49m
Master Google Forms: Create, Analyze, and Collaborate in 2 Hours - Surveys, Quizzes, Data Management, Automation


.MP4, AVC, 1280x720, 30 fps | English, AAC, 2 Ch | 2h 1m | 360 MB
Instructor: Chris Dutton
Deepen your Excel knowledge by picking up powerful and effective analytics techniques used by Excel pros. In this course, instructor Chris Dutton shows how to leverage intermediate to advanced Excel analytics functionality using crystal clear demos, real-world case studies, and bite-sized lessons.
Each video is self-contained and focuses on a key tool or feature that you can add to your Excel tool kit. Learn how to conduct outlier detection, perform Monte Carlo simulations, and use CUBE functions. Plus, explore forecasting, using the Goal Seek feature, and leveraging Solver to tackle complex optimization models in Excel.

.MP4, AVC, 1280x720, 30 fps | English, AAC, 2 Ch | 1h 38m | 310 MB
Instructor: Chris Dutton
Go from beginner to power PivotTable user. Learn how to use Excel PivotTables and PivotCharts for powerful data analysis. Chris Dutton leads this practical guide, filled with lots of hands-on exercises and real-world use cases. He shows how to structure your data; change table layouts and styles; leverage design controls; perform sorting, filtering, and grouping; and create interactive dashboards. Use the PDF cheat sheets and the Excel solution file to follow along as you learn.

Learn all the features and options of software with realtime office projects
Easy way to start learning Essential Skills of PowerPoint and Google Slide Detail and Practice within 2 hours


.MP4, AVC, 1280x720, 30 fps | English, AAC, 2 Ch | 45m | 119 MB
Instructor: Dennis Taylor
If you work in Excel, you know that even a small error can have big consequences, throwing off important calculations or transmitting incorrect information to your team. In this concise course, Excel expert Dennis Taylor provides quick and easy tips to help you avoid common mistakes.
Dennis begins with the basics—how to display data so that errors can be easily spotted, enter data correctly the first time, and apply shortcuts for frequent entries. Dennis provides easy ways to protect worksheets and validate your data—techniques that are particularly helpful when multiple team members are contributing to the same spreadsheet. He also shows how to correctly use row and column references and avoid mistakes in formulas.
 4
4
.MP4, AVC, 1280x720, 30 fps | English, AAC, 2 Ch | 4h 7m | 828 MB
Instructor: Chris Dutton
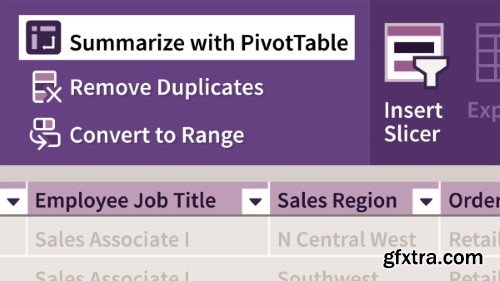
While the power and time-saving value of PivotTables appeals to anyone who analyzes data in Excel, many users are too intimidated by the feature to add it to their workflow. In this course—the first installment in a two-part series—instructor Chris Dutton breaks down how to use PivotTables, as well as how to add PivotCharts to the mix to summarize your data visually.
Throughout the course, Chris shares practical tips and demonstrations that help you grasp how these tools are used in the real world, as well as how PivotTable values are actually calculated and displayed. Learn how to prepare your raw data for analysis; leverage formatting, sorting, filtering, and grouping options; display values in multiple ways; create PivotCharts; and much more.

.MP4, AVC, 1280x720, 30 fps | English, AAC, 2 Ch | 2h 22m | 605 MB
Instructor: Chris Dutton
Once you grasp the basics of Excel PivotTables, you're ready to see how this powerful data analysis tool can add value in real-world situations. In this course— the final installment in a two-part series—instructor Chris Dutton dives into ten real-world case studies that showcase how PivotTables can be leveraged to explore and analyze data in a variety of situations.
While the previous installment in this series dove into theory and the general ins and outs of PivotTables, this course helps expand your knowledge by looking at practical applications of the tool. Chris covers case studies on San Diego burrito ratings, historical shark attack records, major league baseball statistics, stock market data, and more.
.MP4, AVC, 1280x720, 30 fps | English, AAC, 2 Ch | 3h 50m | 725 MB
Instructor: Curt Frye
Many Excel users aren’t sure how to use PivotTables. In this course, Excel power user Curt Frye shows you how to navigate the complexity of PivotTables while taking advantage of their power. Curt explains how to build PivotTables from single or multiple data sources, pivot and configure a PivotTable, define a default PivotTable layout, and more. He demonstrates ways to summarize your data, add calculated fields, filter your results, and format your layout to make it more readable.
Curt steps you through how to sort and filter PivotTable data, format your PivotTable and, and apply conditional formats. Plus, he goes over how to create PivotCharts to visualize your data, enhance PivotTables with macros, and use the Data Model feature to build PivotTables from related tables.
.MP4, AVC, 1280x720, 30 fps | English, AAC, 2 Ch | 1h 8m | 217 MB
Instructor: Dennis Taylor
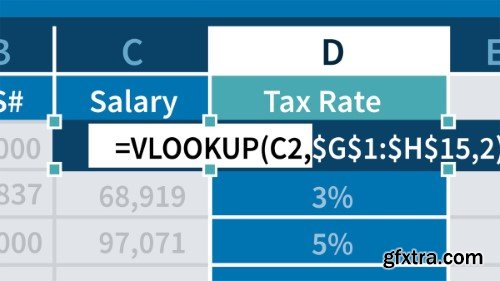
Microsoft Excel offers a variety of powerful lookup functions that allow you to easily retrieve information across spreadsheets. In this course, Excel expert Dennis Taylor demystifies some of the most significant lookup functions. Tune in to learn how to use the new XLOOKUP function, which can handle all the capabilities of the widely used VLOOKUP and HLOOKUP functions, in addition to providing more power and flexibility.
Explore uses of the MATCH function and the newer, more robust XMATCH function to match up data, and learn how to extract data using the INDEX function. Discover how to restructure the lists being searched to ensure that you're using each function efficiently, and learn about dynamic array lookup functions like UNIQUE, SORT, SORTBY, and FILTER. Along the way, Dennis shares practical examples that help you grasp how to implement these functions in your workflow.
SermonBox - Seasonal Collection

SermonBox - The Series Pack Collection

Top Rated News


Would you like to be a Author?