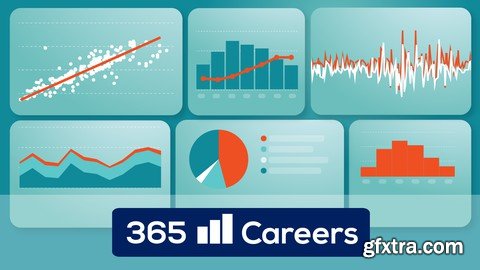
Simple and Advanced Charts: Bar Chart, Pie Chart, Line Chart, Stacked Area Chart, Scatter Plot, Regression Line Plot What you'll learn: Techniques for choosing an appropriate visualization based on your data Approaches to choosing the best colors scheme for a professional presentation How to analyze and interpret basic charts such as bar chart and pie chart How to analyze and interpret more advanced charts such as histograms, line charts, scatter plots, stacked area charts Steps to analyze and interpret combination charts like regression plots and bar and line charts Guidelines and advice on how to build professional data visualizations What to try and avoid when creating a certain type of graphic How to recognize a well-made visualization and identify problem areas for a chart or graphic Requirements You’re a curious person with a desire to learn You are motivated and you want to enhance your data visualization skills Description Do you wish you had superior data interpretation skills? Does your workplace require data visualization proficiency? Do you wish to learn about a rich variety of graphs and charts? If you answered “yes” to any of these questions, this is the course for you. Data visualization is the face of data. Many people look at the data and see nothing. The reason for that is that they are not creating good visualizations. Or even worse – they are creating nice graphs but cannot interpret them accurately. That’s why we’ve created the ‘Introduction to Data Visualization Course’. To help you better understand and interpret different types of charts: Graphs and charts included in the Complete Data Visualization Course: · Bar chart · Pie chart · Stacked area chart · Line chart · Histogram · Scatter plot · Scatter plot with a trendline (regression plot) We live in the age of data. And being able to gather good data, preprocess it, and model it is crucial. However, there is nothing more important than being able to interpret that data. And data visualization allows us to achieve just that. At the end of the day, data charts are what conveys the most information in the shortest amount of time. And nothing speaks better than a well-crafted and meaningful data visualization. The skills you acquire during the course will help you develop an analytical approach when creating any type of chart based on the data you’re given. At the same time, you’ll be able to interpret charts in general, so you’ll be on top of your game whenever you’re examining someone else’s work. You’ll be able to gain insight from a chart in a short amount of time, as well as spot if something is wrong or missing from a visualization. Why do you need these skills? 1. Salary/Income – careers in the field of data science are some of the most popular in the corporate world today. Literally every company nowadays needs to visualize their data, therefore the data viz position is very well paid 2. Promotions – being the person who creates the data visualizations makes you the bridge between the data and the decision-makers; all stakeholders in the company will value your input, ensuring your spot on the strategy team 3. Secure future –understanding data in today’s world is the most important skill to possess and it is only developed by seeing, visualizing and interpreting many datasets Please bear in mind that the course comes with Udemy’s 30-day money-back guarantee. And why not give such a guarantee? We are certain this course will provide a ton of value for you. Let's start learning together now! Who this course is for People interested in data visualization The course is also ideal for beginners, as it starts from the fundamentals and gradually builds up your skills Anyone who wants to gain a valuable skill
TO MAC USERS: If RAR password doesn't work, use this archive program:
RAR Expander 0.8.5 Beta 4 and extract password protected files without error.
TO WIN USERS: If RAR password doesn't work, use this archive program:
Latest Winrar and extract password protected files without error.
SermonBox - Seasonal Collection

SermonBox - The Series Pack Collection

Top Rated News


Would you like to be a Author?